|
|
Using
the
|
|
|
|
|
|
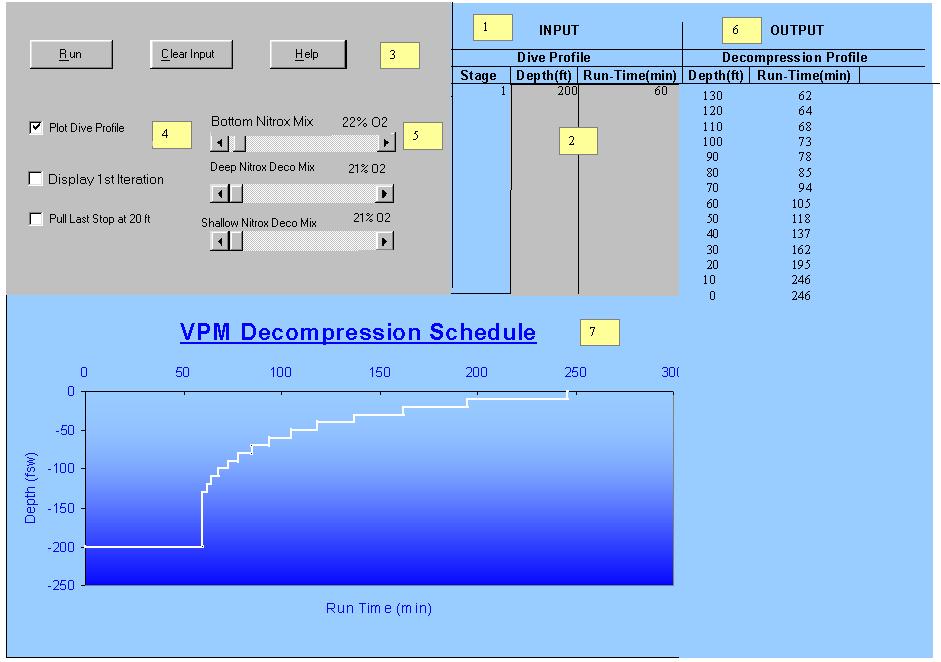
The Front End of VPM.xlsThe program should unzip with Example 2 displayed. To calculate an ascent schedule, begin in cell C4, and type in a depth.Then, enter the corresponding run-time for the stage in cell D4 . Enter any successive stages in the next lower rows (C5 and D5, then C6 and D6, etc.). The program will read the "Depth" and "Run-Time" columns in this sequence from top to bottom until it encounters a blank row. At his point, it calculates the ascent schedule for the sequence of stages above the blank row. Each complete entry is assigned a stage number in column B after the program reads it in. An incomplete or incorrect entry should result in an error message with instructions for correcting the problem. Examples of incomplete entries are: a stage depth but no runtime or stage run-time but no depth. Examples of incorrectly formatted entries include entering a deeper-than-previous stage depth in a lower row or entering a stage run-time that is equal to or less than a previous stage's run time. Note that unlike the QuickBasic version, an error message is generated if dive stages are not in order of deepest first. Try testing some pathological entries to see what's going on. After you complete the entry of the stages, hit the Run button and an ascent schedule should then be output. Everything is on one sheet, (except for the help form) with no controls on additional forms, etc. A .jpg of the sheet VPM.xls is shown with yellow flags calling out notes that describe the controls and display. There are no ToolTips or help for the controls. Just a little bit of input checking and error control. Input ExamplesExample 1 This example is given in ref. 1 --it is not a proper choice of gases for actual diving. A 1-hour dive to 200 feet is made on air. Decompression is on air. Dive: Enter 200 in cell C4, and 60 in cell D4. Set the scroll bar as: Bottom Nitrox Mix = 21%. Ascent: Set the scroll bars as: Deep Nitrox Mix = 21%; Shallow Nitrox Deco Mix = 21%. Total deco time = 205 min.
Example 2 A multistage nitrox dive is made for 30 min at 125 feet then for 30 min at 100 feet using 32% ppO2 bottom mix. Deco is on 32% until the 20 foot stop, where the switch is made to oxygen. The 10 ft stop is pulled at 20 feet. Dive: Enter 125 in cell C4, and 30 in cell D4. Enter 100 in cell C5, and 60 in cell D5. Note that the stage times have been converted to run times. Set the scroll bar as: Bottom Nitrox Mix = 32%. Ascent: Set the scroll bars as: Deep Nitrox Mix = 32%; Shallow Nitrox Deco Mix = 100%. Check the Pull Last Stop at 20 ft Box. Total deco time = 19 min.
Example 3 A dive to 100 feet is made for 40 min on air. Try two different ascent schedules; Ascent 1 is on air; Ascent 2 is on air up to the 20 foot stop, where the switch to oxygen is made. In both cases the last stop is not pulled at 20 feet. Dive: Enter 100 in cell C4, and 40 in cell D4. Set the scroll bar as: Bottom Nitrox Mix = 21%. Ascent 1: Set the scroll bars as: Bottom Nitrox Mix = 21%; Deep Nitrox Mix = 21%; Shallow Nitrox Deco Mix = 21%. Total deco time = 40 min. Ascent 2: Set the scroll bars as: Bottom Nitrox Mix = 21%; Deep Nitrox Mix = 21%; Shallow Nitrox Deco Mix = 100%. Total deco time = 19 min. Compared to Ascent 1, the first stop is at 40 feet rather than 50 feet. Also, not only the stop time at 20 feet, but also the deep stop times are also reduced. This result is discussed in the VPM Algorithm Details section of the VPM Overview page Now that you've run these examples, compare the VPM schedules to the ascents calculated by Neo-Haldane (Keller/Buhlmann) based programs (ie: nearly every other program that is available). Especially try plugging the VPM deep stops into these programs as a multilevel dive and see how the schedules compare. |
|
Controls and DisplayBelow the picture of the VPM.xls sheet, notes on each of the seven flagged items are called out. The gray color sections are areas for input. The blue color sections are for program output. All objects are enabled and unprotected. Examples of input are also given.
(1) INPUT For each multilevel dive stage, enter the Depth and Run-time in the corresponding gray colored columns. The Stage column is for program output. Each complete depth/run-time entry is automatically assigned a stage number. (2) Depth and Run-time Columns The input format for each dive stage is in feet of fresh water and run-time in minutes. Just enter numbers --the units are implied. Run-time is the time since starting the decent. If you think in terms of what your bottom timer would read at the end of each stage, then that's your run-time. 32 feet of saltwater = 33 feet of fresh water. 3.3 feet of anything = 1 meter. For example, a dive to 50 m should be input as 165 feet. See the Making Your Own Changes section below for more notes on conversions. For multilevel dives, run the program as you add each new dive stage to verify that the first deco stop is shallower than the next shallowest dive stage. You'll need to run the program a couple of times for multilevel dives.
(3) Buttons The buttons can be activated by either a mouse click or from the keyboard with alt+Underlined character. Run After entering depth(s) and run-time(s), Run to calculate the decompression profile. Clear All input and output is cleared. Help A form summarizing the controls is displayed.
(4) Check Boxes A mouse click either activates or deactivates each item. Activation (denoted by a check) prior to running a calculation results in the following: [v] Plot Dive Profile The stair-step formatted ascent profile that is hidden in the black border of columns H and I is plotted. [v] Display 1st Iteration Outputs the first un-converged ascent schedule. As described in the VPM.xls Algorithm Details section below, the VPM algorithm is different from conventional decompression calculations because the ascent schedule is calculated iteratively. A sequence of increasingly liberal ascent schedules are produced before the final, converged schedule is output. Compare the first and last schedules for some short dives (big difference) and also for long dives (not much difference). [v] Pull last stop at 20 ft The last in-water decompression stop is at 20 ft. Note that the ascent schedule outputs two sequential 20 ft stops.
(5) Scroll Bars Breathing gas settings for bottom mix and two deco mixes are changed by sliding the scroll button. A mouse click on the button may be required to display the proper %O2 in the text box. The program does calculations using the incremental settings of the scroll bars regardless of the value displayed. Bottom Nitrox Mix Set the %O2 of the bottom mix. You track your END, and O2 tox. This %O2 is used for all calculations up to the depth where the Deep Nitrox Mix has a ppO2 = 1.6 Deep Nitrox Mix Sets %O2 of all stops between the MOD of the Deep Nitrox Deco Mix and 20 feet. The MOD is automatically calculated in the code. Shallow Nitrox Deco Mix Sets %O2 of 20 and 10 foot deco mix
(6) OUTPUT The ascent schedule is output in a table in a depth/run-time format. Differences of one minute in profiles are not significant and result from how the code rounds numbers. As an example, an odd 2 minute stop will occasionally show up among 1 min stops. Also short deep stops often skip a 10 foot increment for the same reason.
(7) Chart A stair-step formatted plot of the ascent schedule is plotted. Note that the chart plots data in columns H and I. The chart is built entirely from excel menus. It is not a VBA object.
To see what's going on with this program, open up the source code with the
Excel Visual Basic for Applicatons editor under the "Tools"-"Macro"
menus. I've tried to keep the program as straight-forward as possible with the code
for the sheet "VPM I-O" serving as a complete module along with
minimal input and output formatting and control. Nonetheless, lots of lines are
devoted solely to I/O and have nothing to do with the real algorithm. The code
is clearest in the Q Making Your Own Changes The layout of the controls is handled by the "Control Toolbox" menu bar. Although everything is enabled, you'll need to "ungroup" similar objects before changing properties. By using the VBA project explorer, you can make lots of changes to the input and output without worrying about the details of the algorithm. Simple ways to patch the input and output units from feet to meters are to either write the conversion formulas in two new columns on the sheet VPM or to modify the input lines in SUB DIVEDATA and output in SUB PROFILE. You will need to do a lot of re-coding to do the actual calculations in metric units. Most of the calculations are actually done in the pressure units of "Atmospheres," with 1 atm ~ 1 bar ~ 105 Pascals, so when you see a 33, this is almost certainly 1 ata = 33 feet of salt water. Stops are in 10 foot increments (which is essentially identical to 3 m for nitrox decompression purposes). Also, be careful in SUB DIVEDATA where the four bubble model constants are set. There is a conversion to ata there too.In a similar fashion, you can patch stop times from runtimes to incremental times on the spread sheet. No provision for writing a profile to an output file was made. The easiest way to save output is to just cut and paste to notepad or another spreadsheet.
|
|